


Creating a custom legend for Line Chart
NOTE: This article contains snippets of code from a project I worked on in 2016! It uses jQuery and Google charts API that could have changed.
In the first part of this series, I talked about Treemaps and the usage of getBoundingClientRect() method, which helped us to recreate the rectangles. Now we will take a look at Line chart and we will build a custom interactive legend that will highlight the lines in the chart. As before, I won’t cover everything here and you can **check the code to see implementation details** (one can learn a lot just by reading a code).

Photo by Isaac Smith on Unsplash
A few points I will describe:
initializing Line Chart using DataView class
constructing the custom legend labels (using template literals)
toggling the state of checkboxes
Here is an image of the customized chart we are going to build.
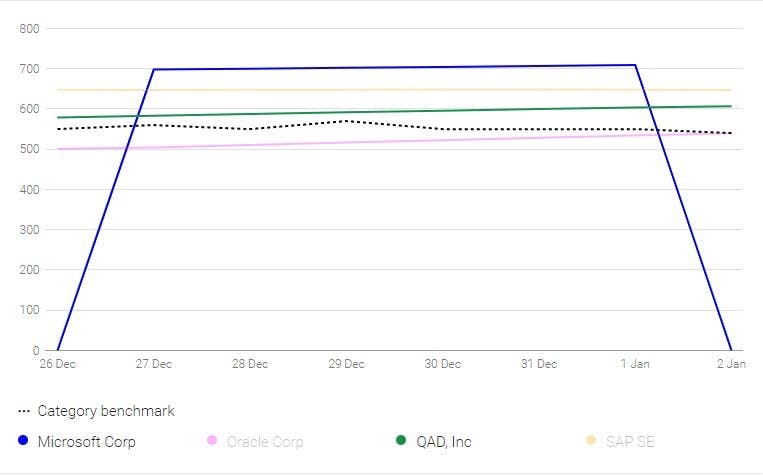
Line chart with a custom interactive legend
In order to show the lines in the chart, we have to feed it with some data. All charts store their data in a table and there are several ways to create them. The tables are either represented as:
(For example, in the 1st part of this series, we created DataTable for Treemap using the helper function arrayToDataTable())
Initializing Line Chart using DataView class
We are going to create an interactive legend, so when we click a label or a line, it will be highlighted. For that, we need to get some information from the chart. Let’s read a summary of the 2 main representations:
A
**DataTableis used to create the original data table. A**DataViewis a convenience class that provides a read-only view of aDataTable, with methods to hide or reorder rows or columns quickly without modifying the linked, original data.
As we can see, DataView provides us with various methods that we can use for example for showing/hiding the rows/columns and getting some data. That’s why DataView is the candidate we choose. We are going to use for example getNumberOfColumns() and getColumnLabel() methods.
Our data in the demo comes from JSON, so we have to first format it to proper DataTable format before we can pass it to DataView object. The format we have to follow looks like this:
{
    "cols":[
        {"id":"Col1","label":"","type":"date"}
    ],
    "rows":[
        {"c":[{"v":"a"},{"v":"Date(2010,10,6)"}]},
        {"c":[{"v":"b"},{"v":"Date(2010,10,7)"}]}
    ]
}
We parse our JSON, construct the rows and columns as above, fill them with the values and create a new DataTable. We have the function called *formatDataForLineChart(data) *that does just that and returns formatted data.
// This is a part of the snippet to demonstrate how we can create the // rows. [**Check out the demo](https://stackblitz.com/edit/customizing-google-linechart?file=index.js)** for more details.

var formattedData = $.parseJSON(jsonData);
var dataCols = [ {id: 'id' + 0, label: 'Date', type: 'string'} ];
var dataRow = [];
...

$.each(formattedData, function(index, days) {
...
    dataRow[i++] = { c: [ { v: formattedDate } ] } ;
    $.each(v, function(index, val) {
        dataRow[i - 1].c[index + 1] = { v: val };
    });
...
}
When we have that we can create the LineChart and display it. Yay!
var data = formatDataForLineChart(json);
var view = new google.visualization.DataView(data);
var chart = new google.charts.Line(document.getElementById('linechart'));
chart.draw(view, options);
Constructing the custom legend labels
We want to display the labels in columns like in this example:
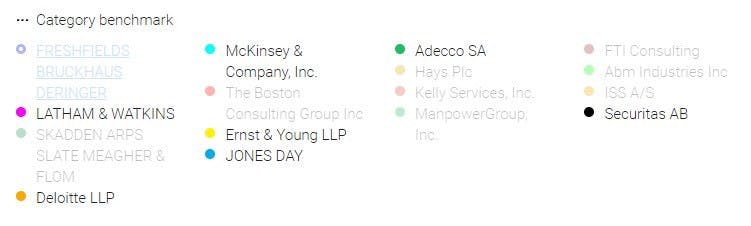
Custom interactive legend
When the chart is ready (event listener) we get the number of columns and iterate through them to create the labels with checkboxes.
google.visualization.events.addListener(chart, 'ready', function() {

    var colsNum = data.getNumberOfColumns();
    var legendAr = [];
    ...

    for (var i = 1; i < colsNum; i++) {
        var legendName = data.getColumnLabel(i);
    var id = data.getColumnId(i);
    var label = createLabel(legendName, id);
        ...
    }
}
Again, please check the demo for more details.
Let’s take a closer look at createLabel() function though. We define HTML as a string and return it. Since it’s a longer string we use ‘+’ operator to join it together.
function createLabel(name,i) {
    var label = '<label for="'+i+'" class="niceCheckbox on" data-   group="suppliersGroup">' **+**
    '<input class="legendCheckbox" type="checkbox" id="'+i+'" data-id="'+i+'" name="filterCheck" value="'+name+'" checked>' **+**
    '<span class="text">'+name+'</span>' **+**
    '</label>';

    return label;
}
That’s the old fashion way, but we can improve it by using template literals!
Template literals are string literals allowing embedded expressions. You can use multi-line strings and string interpolation features with them.
This is great because we can omit all the single quotes and pluses. We just have to enclose our string with the backticks and use placeholders with ${expression}
It would look like this:
function createLabel(name,i) {
    var label = **`**<label for="**${i}**" class="niceCheckbox on" data-group="suppliersGroup">
    <input class="legendCheckbox" type="checkbox" id="**${i}**" data-id="**${i}**" name="filterCheck" value="**${name}**" checked>
    <span class="text">**${name}**</span>
    </label>**`**;

    return label;
}
It looks cleaner, isn’t it? Ok, lastly let’s see how we can select the lines and labels.
Toggling the state of checkboxes
As you might notice, we added data attributes on the elements we created with JS (i.e data-id=”${i}”. We did it also for the lines in the chart (targeting the SVG paths). This enables us to make it interactive and highlight the lines/labels on click.
There is a function called *updateLineChartCols() *that contains a bunch of other functions that help us to style the elements and determine whether we should select or deselect the checkboxes.
We can target the checkboxes in the legend, loop through them and toggle the ‘checked’ state like this:
for(var i = 0; i < inputsArr.length; i++) {
    inputsArr[i]**.prop('checked', false);
}
We either set ‘checked’ to true or false based on some previous logic.
Even though I described only a few selected parts of the code I hope you find the overall process useful and you learned something new.
Thank you for reading!