

Customizing Google Charts — Treemaps and Usage of getBoundingClientRect() Method


Treemaps and Usage of getBoundingClientRect() Method
NOTE: This article contains snippets of code from a project I worked on in 2016! It uses jQuery and Google charts API that could have changed.
The project I was working on together with my colleague was designed by Every Interaction studio for a dynamic Procurement Intelligence platform. It contained several charts and tables that had to be interactive and linked together. We decided to use Google charts and build on top of them. I spent most of the time on this task and since there’s a lot to dissect, we will focus now only on Google Treemaps.
***Treemap is a visual representation of a data tree, where each node is displayed as a rectangle. Each node is sized and colored according to its values relative to the other nodes.***
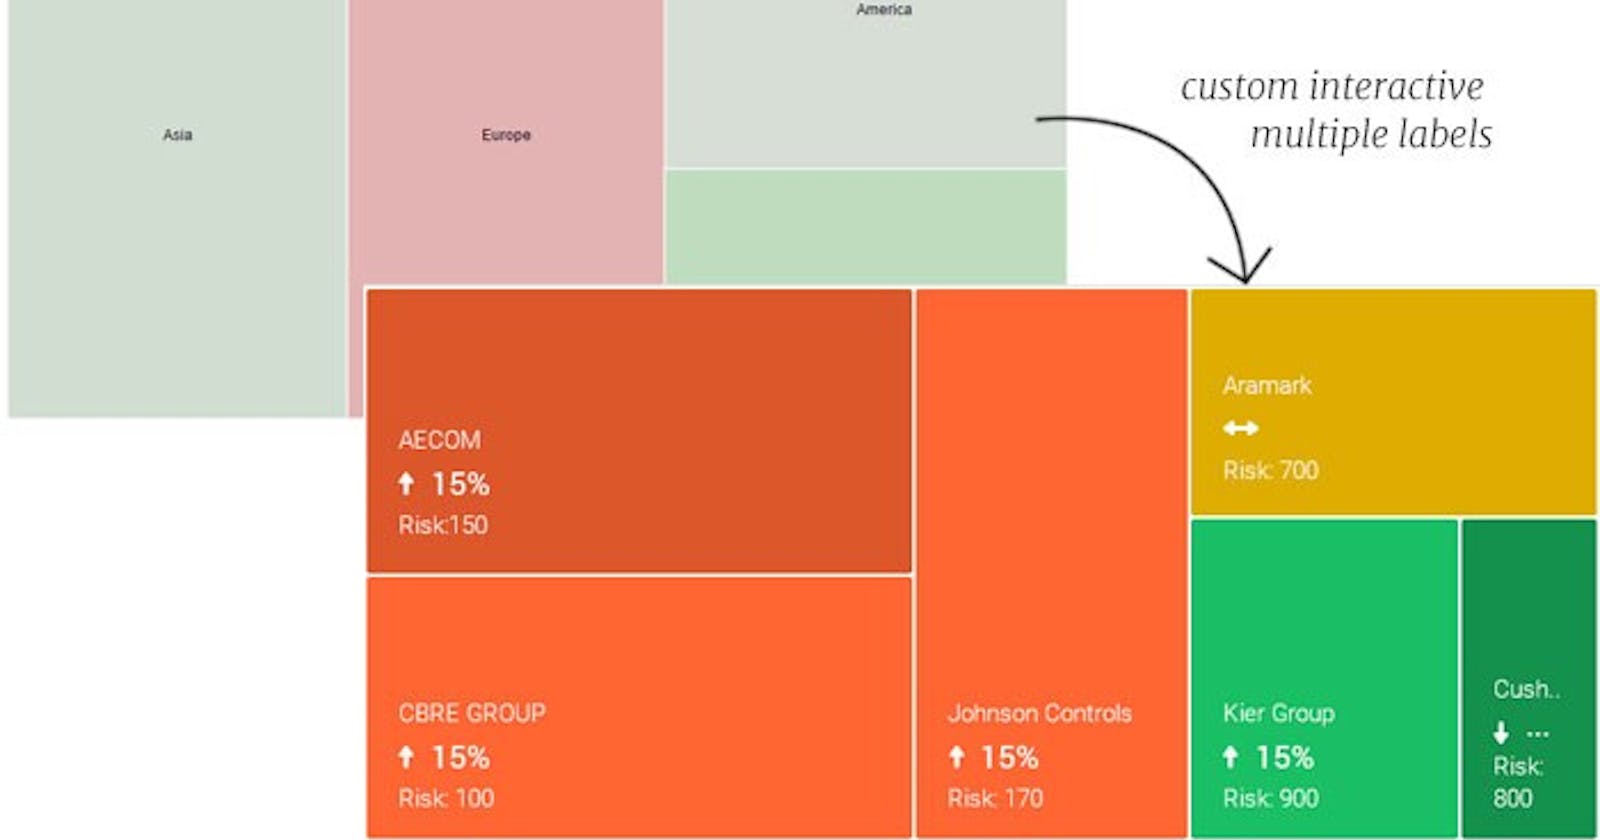
In this article I am going to describe how we can customize the treemap and its nodes. Particularly the position and the amount of displayed data. Treemap nodes display only one value from a data table by default, although we can display other data in a tooltip. We are going to change that. The following picture shows the difference between default example and our customized treemap.

As you can see, we display nicely several values, not just 1 in the center. Google provide us with *generateTooltip *option where you can display multiple values on hover, but we will create our own function that will make the tooltip appear as a black box in top left corner (instead of the default look and behaviour => showTooltips: false)
In our case, when we click on a node, we just want to highlight it as selected. We don’t need go down and up the levels, therefore we can use then maxDepth: 0 (default is 1).
Enough theory, let’s write some code!
I prepared a **demo on Stackblitz**, so you can check out the result there. Please check also the HTML file to see how we load the Google packages and SCSS for styling.
The main function we declare is called *drawTreemap() *and has no parameters. At the beginning we define heatmapData array with our data we want to display. Then we use Google methods to define and visualize the tree and we configure the *opts *object. That’s what is required to display the basic treemap, and you can read more about it in the Google docs linked above.
Inside of the main function we declare another function called *showInfo(). We use this function to build on top of the treemap. We know that each node is a rectangle, so we can get the dimensions and coordinates of each node, and recreate the treemap. We are going to use \getBoundingClientRect()* method for that.
**getBoundingClientRect() returns the size of an element and its position relative to the viewport.
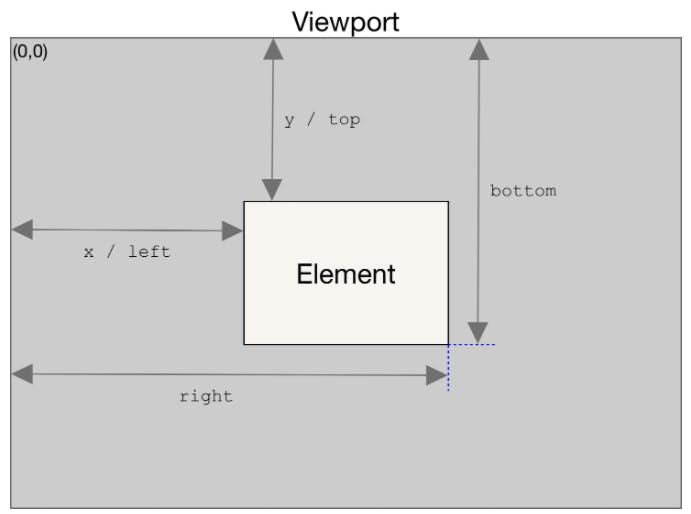
I think this method is very handy as I’ve used it many times in different kinds of projects. If it’s new for you, add it to your JS arsenal :-) If we inspect the treemap, we can see it consists of SVG rectangles that are gouped by <g> element. We can target them and iterate through each node to run the few functions I am about to describe.
var svg = treechart.find('svg');
var cells = svg.find('g');
cells.find('text').hide();

cells.each(function(i, item) {
    var cell = $(item);
    var xy = getCellCoordinates(cell);
    var tableData = getTableData(i);
    var cellColor = setColor(tableData);
    var extraCell = makeInfoCell(tableData, xy, cellColor);
    $("#page").append(extraCell);
});
The first one is *getCellCoordinates(cell)*
function getCellCoordinates(cell) {
    var top = window.pageYOffset || document.documentElement.scrollTop;
    var rect = {
        top: cell[0].getBoundingClientRect().top,
        left: cell[0].getBoundingClientRect().left,
        width: cell[0].getBoundingClientRect().width,
        height: cell[0].getBoundingClientRect().height
    };
    if (top > 0) {
        rect.top = rect.top + top;
    }
    return rect;
}
We retrieved the size and position of each rectangle using *getBoundingClientRect()* and stored it to xy variable. Next we have:
var tableData = getTableData(i);
This function creates data object and store values to its properties using Google’s *DataTable getValue()* method. We do this so we can easily pass it to other functions and manipulate with data. For example we pass tableData to setColor() function:
var cellColor = setColor(tableData);
setColor() function as its name suggests, sets the colors we define to rectangles based on values we passed to the function. And lastly we call makeInfoCell() function:
var extraCell = makeInfoCell(tableData, xy, cellColor); $("#page").append(extraCell);
makeInfoCell() function takes 3 parameters that we defined and calculated:
data
coordinates
color
Based on these parameters it creates HTML for new rectangles and custom tooltip that we then append to the page. Notice that on hover, when we want to display the tooltip, we again use getBoundingClientRect() method to correctly position it within the rectangle.
$(".cellInfo").on("mouseenter touchstart", function(e) {
    var cell = $(this);
    var hoverBox = cell.find(".hoverBox");
    var cellWidth = cell[0].getBoundingClientRect().width;
    var cellHeight = cell[0].getBoundingClientRect().height;
    var hoverBoxWidth = hoverBox[0].getBoundingClientRect().width;
    var hoverBoxY = hoverBox[0].getBoundingClientRect().right;
    var treemapDivY = treechart[0].getBoundingClientRect().right;
...
And that’s it! I encourage you to check the code and look at the functions described above to get more clarity. Ohh and I said we want to highlight selected rectangles as in the GIF. It’s time to practice some JS :-)
Have you ever used *getBoundingClientRect() *before? In what use case? Let me know in the comments.
Thanks for reading!